
Table of Contents
- What’s Inside an Industrial Hygiene Monitoring Report
- Industrial Hygiene Sampling Methods and How They Affect Results
- Understanding Occupational Exposure Limits
- How to Interpret Exposure Monitoring Results
- Reading an Exposure Monitoring Report Example
- What to Do When Results Exceed Exposure Limits
- Next Steps After Receiving Your Monitoring Report
- Frequently Asked Questions
Last Updated: October 10, 2026
What’s Inside an Industrial Hygiene Monitoring Report
An industrial hygiene monitoring report is a detailed record of workplace exposure measurements collected to assess whether employees face hazardous conditions. These reports translate raw sampling data into actionable findings that guide safety decisions and regulatory compliance.
Understanding what a monitoring report contains, and how to read it, separates reactive safety responses from proactive risk management. Most facility managers receive these reports but struggle to interpret the technical sections or know what actions to take next.
Report structure and key sections
A typical industrial hygiene monitoring report follows a consistent structure designed for clarity and regulatory compliance.
The executive summary sits at the front. This section distills findings into plain language: what was monitored, where, and whether results exceeded occupational exposure limits. If you only read one section, this is it.
Next comes the methodology section. This explains which sampling methods were used, how many samples were collected, and where samples were taken. This matters because sampling strategy directly affects whether results represent actual worker exposure.
The results section presents the data. You’ll see tables with sample locations, sampling times, measured concentrations, and how those concentrations compare to occupational exposure limits. This is where the numbers live.
Finally, the recommendations section offers specific actions. These range from engineering controls (ventilation upgrades) to administrative changes (rotation schedules) to personal protective equipment requirements.
Industrial Hygiene Sampling Methods and How They Affect Results
The method used to collect samples fundamentally shapes what the results actually tell you about worker exposure. Two main approaches exist, and they answer different questions.
Personal sampling versus area sampling
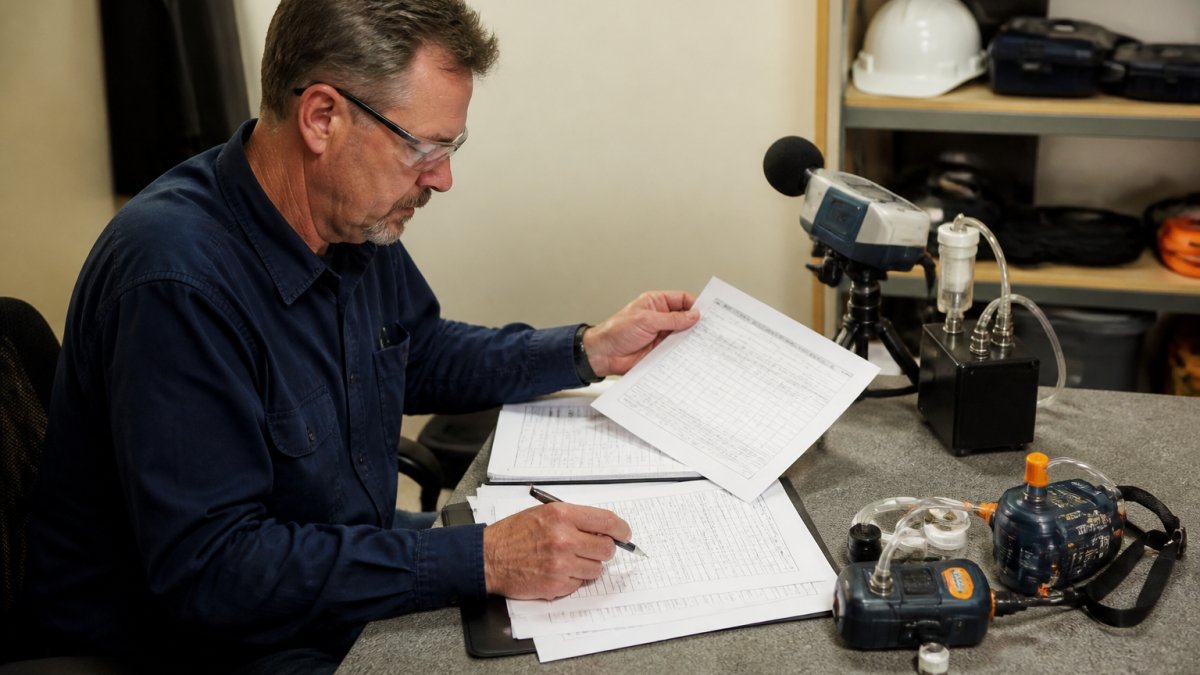
Personal sampling collects air directly from the breathing zone of a specific worker. A pump worn on the belt pulls air through a collection device, a filter, sorbent tube, or impinger, for the entire work shift or task. This approach measures what one person actually breathes.
Area sampling places a stationary pump at a fixed location in the workplace. It captures the general air quality in a work zone, not what any individual worker inhales. Area samples are useful for identifying hotspots or tracking conditions over time, but they don’t directly measure individual exposure.
The distinction matters. A worker standing 10 feet from a dust source may breathe cleaner air than the area sample collected 2 feet away. Conversely, a worker positioned directly in a source’s plume may face higher exposure than the area measurement suggests.
Industrial hygiene monitoring reports typically include both. Personal samples establish whether individual workers exceeded limits. Area samples identify where concentrations are highest and guide control decisions.
Sampling strategy and representativeness
A single sample tells you almost nothing. Meaningful results require a sampling strategy that captures the range of conditions workers actually face.
A good strategy considers:
- Which jobs or tasks create the highest exposure
- How many workers do each task
- Seasonal or shift variations in production
- Time of year or equipment condition changes
Samples collected during a slow production day may show lower concentrations than a typical high-volume day. Samples taken only during morning shifts miss afternoon conditions. A monitoring report should explain the sampling strategy so you understand whether results represent typical conditions or a snapshot of one moment.
Understanding Occupational Exposure Limits
Occupational exposure limits define the maximum concentration of a hazardous substance workers can be exposed to without harm. These limits are the benchmark against which all monitoring results are compared.
Multiple types of limits exist, and they measure different exposure scenarios.
Time-weighted averages versus ceiling limits
A time-weighted average (TWA) is the average concentration over a full shift, typically 8 hours. If a worker breathes a high concentration for 1 hour and a low concentration for 7 hours, the TWA averages those out.
A ceiling limit is the maximum concentration at any single moment. Even if the TWA is acceptable, a brief spike above the ceiling limit is a violation. Ceiling limits protect against acute effects from sudden high exposures.
Most hazardous substances have a TWA limit. Some have both a TWA and a ceiling limit. A few have only a ceiling limit. The monitoring report should clearly identify which type of limit applies to each substance.
Short-term exposure limits and peak exposures
A short-term exposure limit (STEL) is the average concentration over a brief period, usually 15 minutes. It captures exposures from specific tasks or equipment operations that create temporary spikes.
Peak exposures are the highest concentrations measured during sampling. A monitoring report will compare peak values against ceiling limits and STELs to determine whether any moment exceeded safe thresholds.
How to Interpret Exposure Monitoring Results
This is where most readers get lost. The numbers mean nothing without context, and the decision-making process is rarely explained clearly. A structured approach to reading results prevents both false reassurance and unnecessary overreaction.
Step 1: Identify the measured value and applicable limit
Start by locating the measured concentration and the occupational exposure limit that applies to it. The monitoring report should present these side by side in a results table.
Example:
| Substance | Worker/Location | Measured Concentration | Limit Type | Limit Value | Status |
|---|---|---|---|---|---|
| Toluene | Worker A (painter) | 45 ppm | TWA (8-hour) | 50 ppm | Below limit |
| Toluene | Worker B (painter) | 62 ppm | TWA (8-hour) | 50 ppm | Exceeds limit |
| Toluene | Worker A (peak) | 120 ppm | Ceiling | 300 ppm | Below limit |
Notice that the same substance can have multiple limits (TWA and ceiling). A result can be below the TWA but still acceptable if the ceiling is not exceeded, or vice versa. The report should clarify which limit applies to each measurement.
Step 2: Evaluate results below the detection limit
Many samples return results reported as “<0.5 mg/m³” or “ND” (nondetect). This does not mean zero exposure, it means the laboratory could not measure a concentration reliably below that threshold.
The detection limit is the lowest concentration the analytical method can distinguish from background noise. If a sample shows “<0.5 mg/m³,” the actual concentration could be anywhere from zero to 0.5 mg/m³.
How to interpret this:
- If the detection limit is well below the occupational exposure limit (e.g., detection limit 0.5 mg/m³, exposure limit 10 mg/m³), a nondetect result is reassuring. Even if exposure was at the detection limit, it would still be safe.
- If the detection limit is close to or above the occupational exposure limit (e.g., detection limit 8 mg/m³, exposure limit 10 mg/m³), a nondetect result is ambiguous. You cannot confidently say exposure is safe.
When nondetects are problematic, the monitoring report should recommend lower detection limits or more sensitive analytical methods. Request resampling with a better method if the current detection limit does not clearly separate safe from unsafe.
Step 3: Assess uncertainty and data quality
Every measurement carries uncertainty from multiple sources:
- Pump calibration error: Air samplers are calibrated to pull air at a specific rate (e.g., 2 liters per minute). If the actual rate drifts to 1.8 or 2.2 L/min, the measured concentration shifts proportionally.
- Collection efficiency: Filters and sorbent tubes do not capture 100% of the target substance. A filter might capture 95% of dust, meaning the measured value is 95% of true exposure.
- Laboratory analysis variability: Repeated analysis of the same sample may yield slightly different results due to instrument drift, reagent variation, or analyst technique.
- Sampling representativeness: A sample collected on a slow production day may not represent typical high-volume conditions.
A robust monitoring report will state the overall uncertainty, often expressed as a percentage (e.g., “Results are accurate within ±20%”). This helps you evaluate whether a result is truly safe or too close to the limit to be confident.
Example of uncertainty in decision-making:
A measured result is 9.5 mg/m³ against a limit of 10 mg/m³. This appears to be below the limit by a small margin. However, if the measurement uncertainty is ±20%, the true concentration could be as high as 9.5 × 1.20 = 11.4 mg/m³, which exceeds the limit. In this case, the result is too uncertain to conclude that exposure is safe.
When results are within the uncertainty range of the limit, the report should recommend either implementing controls anyway or collecting additional samples to narrow the uncertainty.
Step 4: Compare results to the appropriate exposure limit type
Different limit types answer different questions:
- Time-weighted average (TWA): The average concentration over a full shift (usually 8 hours). Compare the reported TWA directly to the TWA limit.
- Short-term exposure limit (STEL): The average concentration over a brief period, usually 15 minutes. STELs capture exposures from specific tasks or equipment operations. Compare the reported STEL to the STEL limit.
- Ceiling limit: The maximum concentration at any single moment. Compare the peak measured value to the ceiling limit. Even if the TWA is acceptable, a single spike above the ceiling is a violation.
A result can pass one limit and fail another. For example:
- Measured TWA: 8 ppm (limit 10 ppm), passes
- Measured STEL: 25 ppm (limit 15 ppm), fails
- Measured peak: 45 ppm (ceiling 50 ppm), passes
In this case, the worker’s average exposure is safe, but a specific task creates a brief high exposure that exceeds the short-term limit. The recommendation would focus on controlling that specific task, not the overall work shift.
Step 5: Evaluate sampling strategy and representativeness
Before drawing conclusions from results, confirm that sampling captured the conditions workers actually face.
Ask these questions:
- Were samples collected during typical production? Sampling on a slow day or during maintenance may not represent normal exposure.
- Were all high-exposure tasks sampled? If the report sampled only office workers and not the workers in the production area, results do not describe the highest-risk group.
- Was sampling done across multiple shifts or days? A single sample on one shift may miss seasonal variation, equipment condition changes, or shift-specific differences in production volume.
- Were both personal and area samples collected? Personal samples show what workers breathe; area samples identify hotspots. Both are needed for a complete picture.
If the sampling strategy is limited, the report should acknowledge this and recommend additional monitoring. A result that appears safe may not be trustworthy if sampling was not representative.
Step 6: Make a decision
Once you have evaluated the measured value, detection limits, uncertainty, limit type, and sampling representativeness, you can make a decision:
If results are clearly below the limit and sampling was representative:
Exposure is acceptable under current conditions. Document the result and schedule routine follow-up monitoring (typically annually or when processes change).
If results are close to the limit (within the measurement uncertainty):
Exposure is in a gray zone. Implement precautionary controls (engineering or work-practice) and resample within 30-60 days to verify that controls reduced exposure. Do not wait for a result that clearly exceeds the limit.
If results exceed the limit:
Exposure is unacceptable. Implement controls immediately (see “What to Do When Results Exceed Exposure Limits” section below). Prioritize the highest-exposure workers or tasks first. Resample within 30-90 days to verify that controls worked.
If results are nondetect and the detection limit is close to the exposure limit:
Uncertainty is too high to conclude safety. Request resampling with a lower detection limit or a more sensitive analytical method. Implement precautionary controls while awaiting results.
Key takeaway: Interpreting results is not a simple pass/fail check. It requires evaluating the measured value, the applicable limit type, measurement uncertainty, detection limits, and whether sampling was representative of actual worker exposure. When in doubt, implement controls and resample to verify effectiveness.
Reading an Exposure Monitoring Report Example
Walking through a real report section by section shows how these concepts work in practice and how to translate findings into a prioritized action plan.
Example: Silica dust exposure at a concrete cutting operation
Imagine a report on respirable crystalline silica (RCS) exposure at a concrete cutting operation. The facility cuts concrete indoors and outdoors, using both wet and dry methods.
Executive Summary:
Three workers were sampled over one full shift on a typical production day. Two results were below the occupational exposure limit of 0.025 mg/m³. One result was 0.032 mg/m³, exceeding the limit. Area samples confirmed that indoor cutting without ventilation created concentrations as high as 0.045 mg/m³.
Methodology:
Personal air samplers were worn by each worker for the entire 8-hour shift. Samples were collected on filters and analyzed by X-ray diffraction to measure respirable crystalline silica. The detection limit was 0.003 mg/m³. Pumps were calibrated before and after sampling. Area samples were collected at two locations: one indoors near the cutting station, one outdoors.
Results Table:
| Worker | Task | Location | Measured Concentration | Limit | Status | Notes |
|---|---|---|---|---|---|---|
| Worker A | Cutting | Outdoor (wet method) | 0.008 mg/m³ | 0.025 mg/m³ | Below limit | Spent 6 of 8 hours outdoors with wet cutting |
| Worker B | Cutting | Indoor (dry method) | 0.032 mg/m³ | 0.025 mg/m³ | Exceeds limit | Spent 6 of 8 hours indoors without ventilation |
| Worker C | Cutting | Mixed (wet + dry) | 0.018 mg/m³ | 0.025 mg/m³ | Below limit | Spent 4 hours outdoors, 4 hours indoors with wet method |
| Area Sample 1 | , | Indoor cutting station | 0.045 mg/m³ | , | , | Peak concentration during dry cutting |
| Area Sample 2 | , | Outdoor cutting area | 0.006 mg/m³ | , | , | Typical outdoor conditions |
Interpreting the results
Hazard identification:
Respirable crystalline silica is the primary hazard. All workers are exposed; the question is how much.
Exposure profile:
Worker B faces the highest exposure because:
- Worker B spent most of the shift indoors (poor ventilation)
- Worker B used dry cutting (generates more dust than wet cutting)
- Worker B worked without local exhaust ventilation
Worker A’s exposure is lowest because:
- Worker A spent most of the shift outdoors (natural ventilation)
- Worker A used wet cutting (suppresses dust)
Worker C is in the middle because of mixed task assignment.
Data quality assessment:
The detection limit (0.003 mg/m³) is well below the exposure limit (0.025 mg/m³), so nondetect results would be reassuring. All three results are above the detection limit, so they are quantified reliably.
The report states that pumps were calibrated before and after sampling, which is good practice. Assuming standard measurement uncertainty of ±20%, Worker B’s result of 0.032 mg/m³ could range from 0.026 to 0.038 mg/m³. Even at the lower bound, it exceeds the limit of 0.025 mg/m³.
Sampling representativeness:
The report notes that sampling occurred on a “typical production day.” This is important because production volume, equipment condition, and ventilation can vary. If this was a slow day, actual exposure on high-volume days could be higher. The area samples (0.045 mg/m³ indoors) suggest that peak exposures during active cutting are even higher than Worker B’s 8-hour average.
Translating findings into an action plan
Priority 1: Address Worker B’s exposure immediately
Worker B exceeded the limit. This is the highest-risk situation and requires immediate action.
Options:
- Engineering control (preferred): Install local exhaust ventilation on the cutting equipment or move indoor dry cutting to an area with better ventilation. This protects Worker B and any future worker assigned to this task.
- Work-practice control (interim): Rotate Worker B to outdoor cutting or wet cutting methods for the remainder of the shift. This reduces exposure while engineering controls are being designed.
- Respiratory protection (temporary): Issue a NIOSH-certified respirator (P100 or higher for RCS) and conduct fit testing. This is not a long-term solution but provides immediate protection while controls are implemented.
Priority 2: Prevent Worker C’s exposure from increasing
Worker C is below the limit but close enough (0.018 mg/m³ vs. 0.025 mg/m³) that any increase in indoor work or shift to dry cutting could push exposure over the limit. Implement the same engineering controls planned for Worker B to keep Worker C’s exposure low.
Priority 3: Maintain Worker A’s low exposure
Worker A’s exposure is low because of outdoor work and wet cutting. Continue this practice. If Worker A must work indoors, ensure the same ventilation controls are in place.
Recommended controls (in order of preference)
Engineering controls:
- Install a dust collection system on the cutting equipment (local exhaust ventilation). This is the most effective approach because it protects all workers automatically.
- Alternatively, move indoor cutting to an outdoor area or a dedicated cutting room with mechanical ventilation.
- Upgrade to wet cutting methods for all indoor work. Wet cutting suppresses dust and reduces airborne concentrations significantly.
Work-practice controls:
- Assign Worker B to outdoor cutting or wet cutting tasks until engineering controls are in place.
- Rotate workers between high-exposure and low-exposure tasks to distribute exposure over the workforce (though this does not eliminate the hazard).
- Increase cleaning frequency to reduce settled dust that can be resuspended.
Respiratory protection (interim only):
- Issue P100 respirators to Worker B and any other worker assigned to indoor dry cutting.
- Conduct fit testing to ensure proper seal.
- Provide training on proper use, maintenance, and replacement of filters.
- This is a temporary measure while engineering controls are being installed.
Verification and follow-up
Timeline:
- Week 1: Issue respiratory protection to Worker B and implement work-practice changes (rotate to outdoor/wet cutting).
- Weeks 2-4: Design and install local exhaust ventilation or upgrade to wet cutting equipment.
- Week 6-8: Resample Worker B and the area near the cutting station to verify that controls reduced exposure.
Success criteria:
- Worker B’s exposure should drop to below 0.025 mg/m³ (ideally below 0.015 mg/m³ to provide a safety margin).
- Area samples should show concentrations below 0.020 mg/m³ during active cutting.
- If resampling shows no improvement, the control was ineffective or improperly installed. Troubleshoot (e.g., is the ventilation system running? Is the dust collection system clogged?) and resample again.
Ongoing monitoring:
- After controls are verified to work, schedule annual monitoring to confirm that exposure remains below the limit.
- If equipment is upgraded, processes change, or new workers are assigned to cutting tasks, resample to verify that exposure is still controlled.
- If respiratory protection is used, ensure that fit testing is repeated annually and that workers are trained on proper use.
Common mistake: Implementing respiratory protection and then assuming the problem is solved. Respiratory protection is a temporary measure. The goal is to eliminate the hazard through engineering controls so that respiratory protection is no longer needed. If you are still issuing respirators after 6 months, the engineering control was not implemented or is not working.
Why this example matters
This example shows that interpreting a monitoring report is not a simple pass/fail check. It requires:
- Understanding what each result means in context (Worker B’s high exposure is driven by task and location, not inherent job risk)
- Identifying the highest-risk worker or task first (Worker B, indoor dry cutting)
- Choosing controls in the right order (engineering first, work-practice second, respiratory protection last)
- Setting a timeline and success criteria for verification
- Planning for ongoing monitoring to ensure controls remain effective
A report that simply states “Worker B exceeded the limit” without this context leaves facility managers guessing about what to do next. A well-interpreted report translates findings into a clear, prioritized action plan.
What to Do When Results Exceed Exposure Limits
An exceeded exposure limit is not a crisis, it’s a signal that controls need strengthening.
Engineering and work-practice controls
Engineering controls are the first choice. These eliminate or reduce the hazard at its source, protecting all workers automatically.
Examples include:
- Local exhaust ventilation at dust sources
- Enclosed processes that prevent worker contact
- Equipment upgrades that generate less dust or fume
- Substitution of a less hazardous substance
Work-practice controls come next. These change how work is done to reduce exposure.
Examples include:
- Rotating workers away from high-exposure tasks
- Scheduling high-exposure work during periods of better ventilation
- Wet methods instead of dry methods to suppress dust
- Increased cleaning to reduce settled contamination
Personal protective equipment (respirators, gloves, protective clothing) is the last resort. It protects individual workers but requires proper fit, training, and maintenance. It also imposes burden on workers and may not be worn consistently.
Prioritizing actions and verifying effectiveness
Start with the highest-exposure tasks or workers. If one worker’s exposure exceeds the limit by a small margin while another’s is double the limit, address the second situation first.
Implement one or two major controls, then resample to verify effectiveness. Do not try to fix everything at once. A focused approach lets you measure what actually worked.
After implementing controls, schedule follow-up monitoring within 30 to 90 days. Results should show lower concentrations. If they don’t, the control was ineffective or improperly installed.
| Control Type | Implementation Time | Verification Method | Priority |
|---|---|---|---|
| Engineering controls | 4-12 weeks | Follow-up sampling | First |
| Work-practice controls | 1-2 weeks | Observation and sampling | Second |
| Respiratory protection | Immediate | Fit testing and compliance | Interim only |
Next Steps After Receiving Your Monitoring Report
Do not file the report and forget it. Use it as the foundation for ongoing safety management.
Share findings with workers and supervisors. They need to understand what was measured, whether results were acceptable, and what actions you’re taking. Transparency builds trust and engagement.
Document all recommendations and the actions you take in response. If a recommendation was not implemented, record why. This creates a clear record for regulatory inspections and shows your commitment to continuous improvement.
Schedule follow-up monitoring if any results exceeded limits or if you implemented significant controls. Resampling verifies that changes actually reduced exposure.
Update your written safety program to reflect new findings. If the monitoring revealed a previously unidentified hazard, add it to your hazard assessment. If it showed that a control was ineffective, document the new approach.
At Michael Karl McNeil, we help facility managers and safety professionals translate monitoring results into effective action plans. Our services include report interpretation, control recommendations, and follow-up verification to ensure your workplace stays compliant and your workers stay safe.
Interpreting industrial hygiene monitoring reports requires understanding sampling methods, exposure limits, and how to translate data into action. Many organizations struggle with this step, leaving identified hazards unaddressed or implementing controls that don’t actually reduce exposure. Michael Karl McNeil brings 25 years of fire service and industrial hygiene experience to help you read your reports correctly, prioritize the highest-risk exposures, and implement controls that work. Let us help you move from reactive compliance to proactive risk management.
Frequently Asked Questions
What does a result below the detection limit mean in an industrial hygiene monitoring report?
A below-detection-limit result means the analytical laboratory could not measure the substance at a concentration higher than its detection limit, the lowest concentration the method can reliably identify. This does not mean zero exposure; it means exposure was below what the sampling and analysis method could quantify. Report this as ‘<‘ the detection limit value. For regulatory compliance, below-detection results are typically considered compliant with occupational exposure limits, but document the detection limit so you understand what was actually measured.
How do you compare an exposure monitoring result with an occupational exposure limit?
First, identify which exposure limit applies: time-weighted average (TWA), short-term exposure limit (STEL), or ceiling limit. Check whether the result is expressed in the same units and averaging period as the limit. Divide the measured concentration by the occupational exposure limit. If the result is less than 1.0, exposure is below the limit. If it exceeds 1.0, the limit has been exceeded and control measures must be implemented. Always check whether sampling was representative of actual worker exposure before concluding compliance or non-compliance.
What is the difference between personal sampling and area sampling in industrial hygiene monitoring?
Personal sampling measures exposure directly at a worker’s breathing zone using a pump and collection device worn during work tasks. Area sampling measures airborne contaminants at fixed locations in the workplace. Personal sampling is more representative of actual worker inhalation exposure and is preferred for exposure assessment. Area sampling identifies where hazardous substances are present and helps evaluate engineering controls. Both methods appear in industrial hygiene monitoring reports; understanding which was used is critical for interpreting whether results reflect actual worker exposure.
What should you do if a monitoring result exceeds an occupational exposure limit?
Document the exceedance and identify the work tasks, employee groups, and conditions that led to it. Assess whether engineering controls (ventilation, process isolation) can reduce exposure. Implement work-practice controls (job rotation, break schedules) as interim measures. Re-sample after controls are in place to verify effectiveness. If exceedances persist, consider personal protective equipment as a temporary measure while permanent controls are designed. Report findings to affected workers and document all corrective actions. Repeat monitoring at planned intervals to confirm sustained compliance.


Leave a Reply